Distributing Randomness
A good pseudorandom number generator gives an even distribution of results from 0 to 1 but sometimes in generative art we might want something different. It’s possible to skew or weight the distribution of results, so that certain outcomes are more or less likely. This is useful to manage rarities in a collection, or to control positions, dimensions and other choices within each piece.
This article is a guide on how I manage randomness in my projects. There are two main methods I use:
Skewing randomness across a continuous range with mathematical equations.
Defining discrete options and weighting their probabilities.
All of the examples given are in p5js and I’ll link to lots of code examples in the editor.
Even Distribution
First of all, lets get on the same page with the basics.
This sketch draws 20,000 circles at random x and y positions with an even distribution, meaning they are spread out evenly across the canvas in both axes.
function setup() {
  createCanvas(700, 700);
  noStroke();
  background(250);
  fill(0,0,0);
}

function draw() {

  for(let i = 0; i < 40000; i++){
    // Generate random x & y position
    let x = random(0, 700);
    let y = random(0, 700);

    // Draw circle at that position
    circle(x, y, 2);
  }

  noLoop();
}
Skewing the results
To skew distributions, I use mathematical equations from easings.net, where they are actually intended to be used for animation.
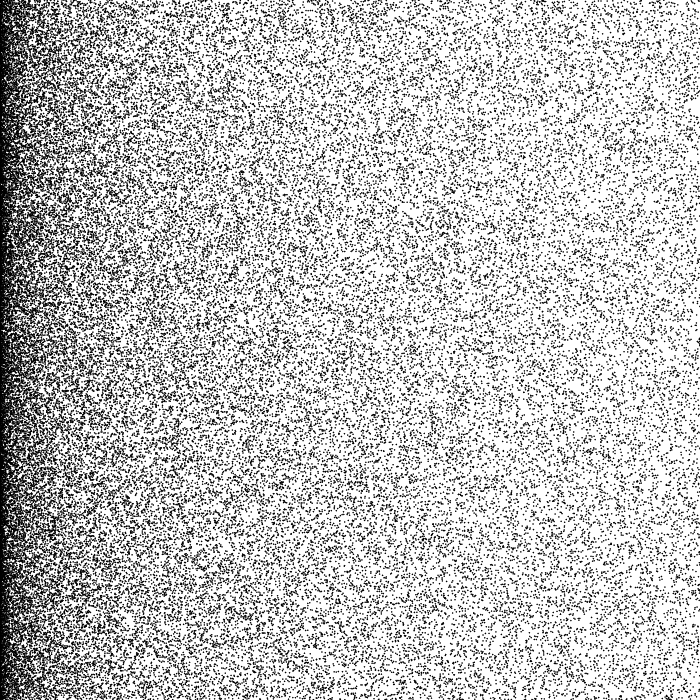
Let’s look at a simple example. The distribution of the y positions is still even, while the distribution of the x positions is skewed to the left.
function setup() {
  createCanvas(700, 700);
  noStroke();
  fill(0,0,0);
}

function draw() {

  for(let i = 0; i < 40000; i++){
    // Generate random y position
    let y = random(0, height);

    // Generate x position
    let rand = random();
    let skewed = easeInQuad(rand);
    let x = map(skewed, 0, 1, 0, width);

    circle(x, y, 2);
  }

  noLoop();
}

function easeInQuad(x){
  return x * x;
}
There are three steps to generating the skewed result, shown separately in lines 14 - 16.
First generate a random number from 0..1
Then input that into the easing function. (The result of that will be skewed but it will still be within the range 0..1)
Map that to the range we want, in this case giving us a number from 0 to the width of the canvas.
The equation itself is visible on lines 24 - 26. It’s a really simple one, just multiplying the random number by itself.
More ways to skew
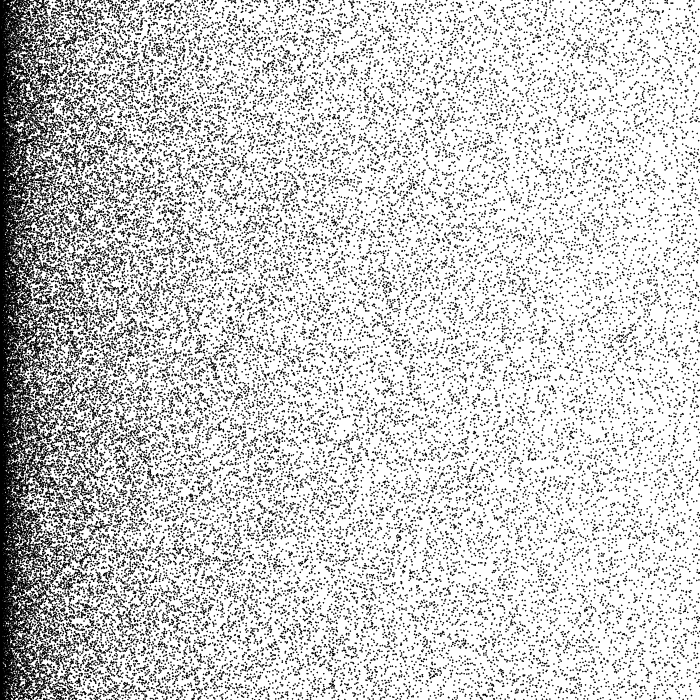
There are lots of nuanced ways we can skew the random distribution, using different equations.
function easeInSine(x){
  return ans = 1 - cos((x * PI) / 2);
}
function easeInCubic(x) {
return x * x * x;
}function easeInCirc(x){
return 1 - sqrt(1 - pow(x, 2));
}function easeInExpo(x){
return x === 0 ? 0 : pow(2, 10 * x - 10);
}Note the subtle differences in the distribution of the dots in each of the examples above.
We can also skew the results towards the outer edges of the range.
function easeInOutCubic(x) {
  return x < 0.5 ? 4 * x * x * x : 1 - pow(-2 * x + 2, 3) / 2;
}
function easeInOutCirc(x){
return x < 0.5
? (1 - sqrt(1 - pow(2 * x, 2))) / 2
: (sqrt(1 - pow(-2 * x + 2, 2)) + 1) / 2;
}Or towards the centre of the range:
function easeOutInSine(x){
  if (x < 0.5){
    x = map(x, 0, 0.5, 0, 1);
    return map(sin((x * PI) / 2), 0, 1, 0, 0.5) // out
  }
  else{
    x = map(x, 0.5, 1, 0, 1);
    return map(1 - cos((x * PI) / 2), 0, 1, 0.5, 1)  // in
  }
}
function easeOutInCubic(x){
if (x < 0.5){
x = map(x, 0, 0.5, 0, 1);
return map(1 - pow(1 - x, 3), 0, 1, 0, 0.5)
}
else{
x = map(x, 0.5, 1, 0, 1);
return map(x * x * x, 0, 1, 0.5, 1)
}
}function gaussian(x){
return randomGaussian(0.5, 0.1);
}The gaussian example is a little different. It’s actually a function included with p5js which takes two parameters, the first is the mean of the results, and the second is the standard deviation around that mean. Using 0.5 and 0.1 as the parameters produces a nice distribution but be aware some results could be outside the 0..1 range.
Here are some simple examples in which lots of low opacity squares are drawn at random distances away from the centre of the canvas. In each image, a different equation has been used to skew the distribution of the distances.
You can see all of these skewing equations and some extras in this demo.
Weighing up the options
Another method I use to manage outcomes is to define discrete options and choose from them. This can be particularly useful for the global settings of each output in a long-form generative art project and managing distribution of various features throughout a collection.
For example, let’s say we’re creating a piece with lots of circles. If we say that there can be anywhere from 10-400 circles, we might find that lots of outputs that have anywhere from 100-300 circles look pretty similar, and we don’t get as many outputs with noticeably “very few” or “lots” of circles as we’d like. Instead, we can create 4 discrete options, and choose either 10, 100, 200 or 400 circles.
I have a function I use to choose from an array of options:
function echoice(options){
  let choice = int(random(options.length));
  return options[choice];
}

// Calling the function
let result = echoice(options);
let options = [10, 100, 200, 400]
I also have a second version of this function, which allows me to weight the probability of each of the options being chosen. This function takes an array of arrays, each with two elements. The first element is the actual option, and the second defines how likely it is to be chosen.
Inside the function, a new array is created, and each option is added to it, as many times as is defined by its likelihood. An option I want to be more likely could be added to the array perhaps 20 or 30 times, while a rarer option is added only once. Then the result is chosen from this array, and the options that are in there more times are more likely to come up (just as buying more raffle tickets gives you a better chance of winning)
function wchoice(options) {
  let opt = [];
  for (let o of options){
    for (let i = 0; i < o[1]; i++){
      opt.push(o[0]);
    }
  }
  let choice = int(random(opt.length));
  return opt[choice];
}

// Calling the function
let result = wchoice(options);
let options = [
  [10, 1],
  [100, 20],
  [200, 30],
  [400, 5]
]
In Maplands I used this technique for several settings.
For example, there is a noise field used to decide which type of shape is drawn in a given location (circle, triangle, dash or square) and there are several options for the resolutions of this noise field. When the field is very small, large areas of the same shape appear because the noise results don’t change much from one side of the canvas to the other. When the field is large, we skip over larger changes in the noise field and different shapes appear next to each other.
This also means settings can easily be named and included as features in a collection.
Very smooth - #44
Smooth - #66
Scattered - #170
Very scattered - # 97
Ranges in the mix
It’s also possible to include ranges as options. This will give us a variety of results between 50-250 and a controlled likelihood of outliers with 10 or 400 circles.
let result = wchoice(options);
let options = [
  [10, 1],
  [random(50, 250), 20],
  [400, 5]
]
Note that the above code will run the random call in the second option as the options array is defined. This is fine if it’s just used once per output, to define some global variable, but if the array is used to define more than one thing in the code, the second option would be the same number throughout.
for(let i = 0; i < 100; i++){
  let result = wchoice(options);
  console.log(result);
}

let options = [
    [10, 1],
    [random(20, 100), 1],
    [100, 1]
  ]
To produce different results for that option each time, we can define the options as functions. Now every time the middle option is chosen, it will generate a different number in the range 20..100.
for(let i = 0; i < 100; i++){
  let result = wchoice(options)();
  console.log(result);
}

let options = [
    [() => 10, 1],
    [() => random(20, 100), 1],
    [() => 100, 1]
  ]
Thinking about these techniques has really added extra dimensions to generative art for me. I’m curious what other methods you use, or to see any work you make using my methods! Let me know on Twitter if you have any suggestions, work to share, or questions!


